This is a guest post by Andrew Halterman.
The Global Knowledge Graph, in the words of Kalev Leetaru, aims to “connect every person, organization, location, count, theme, news source, and event across the planet into a single massive network that captures what’s happening around the world, what its context is and who’s involved, and how the world is feeling about it, every single day.” Because GKG takes the form of a network with entities and themes as nodes and co-mentions as edges, the obvious way to work with it is as a network graph using tools from social network analysis. Kalev's work on Iran shows the remarkable ability of automated community detection algorithms to cluster people according to their countries and connections to the outside given only information about which people appear in the same articles. David Masad's tutorial on using GKG also looks at Iran's leadership, using measures of centrality to identify powerful people in Iran and the degree to which those people are connected to the outside world, with remarkable accuracy.
However, GKG can be used for more than generating static network graphs and measures. Using combinations of date, location, and theme data in GKG, we can make inferences about what themes are closely connected to activities in different locations over time without delving into real social network analysis. Ideally, GKG will be fused with regular GDELT to augment its event data with GKG's new information on the themes, people, and tones involved.
A very large proportion of the work with GDELT has been on studying protests, so I wanted to build on that work by showing what GKG can add to the study of protests specifically, and, more broadly, how it can be used in a non-social network analysis way. These approaches to tracking themes and tone over time, linking locations and themes, and how to present and interpret all of them result from ongoing collaboration with Jill Irvine while writing our paper on measuring civil society activity in Eastern Europe using GDELT, to be presented at the ISA conference in March. Brazil has seen a large number of protests in the last 8 months over a number of issues and presents an interesting case for applying GKG to protests. Journalists and observers have linked the protests to high prices for consumer goods, bus fare increases, police brutality, corruption, and slum demolition in preparation for next summer's World Cup. The Global Knowledge Graph allows us to easily quantify how many of the reported protests are linked to different themes in all of the English language press coverage of Brazil and how this has changed over time.
Brazil: Top Themes
We can begin at the highest level by quantifying the number of “themes” most commonly mentioned in connection with Brazil. The Global Knowledge Graph tags its namespaces (namespaces, roughly, are collections of closely related events) with themes drawn from a set list (available in Excel format according to the the presence of certain defined keywords in the article being coded. Also included in GKG's themes are various taxonomies, which include mentions of specific political parties, terror groups, natural disasters, military ranks, etc., and “functional actors,” for example, “soldier,” “child,” “teacher,” and “president.” I've removed taxonomy and functional actor themes from this chart.
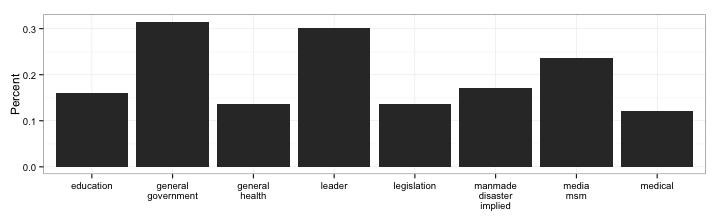
These percentages are calcuated as the number of namespaces with a location in Brazil that are tagged with each theme, divided by the total namespaces with a location in Brazil. The top eight themes for Brazil are very general and are consistent with the top themes for most other countries. Looking at the themes as they relate to another theme (specifically protests) in Brazil will show us much more interesting detail.
Brazilian Protests: Top Themes
Rather than looking at Brazil on the whole, we can focus on just the namespaces with Brazilian namespaces that are tagged with a protest theme. This will show us the top themes connected with Brazilian protest events and the percent of protests they're connected to.

These themes differ slightly from the overall Brazil themes, with the inclusion of the “General Movement” theme reflecting the use of words like “activist” and “movement,” and the appearance of the “armed conflict” theme. “General government” and “leader” are more closely associated with protests than with Brazil as a whole. This chart still tells us very little about the issues the protests revolve around.
Brazilian Protests: Selected Themes Over Time
We can select a number of themes to track, given our thoughts on which themes are linked to the protests. The spark for the protests over the summer was widely reported to be an increase in bus fares. Many of the protests are located in favelas and discussion of the later protests concerned the demolition of existing houses to build new World Cup facilities. We can add themes for public transportation, slums, and new construction to try to monitor these. We can add several other themes to see whether journalists are discussing economic issues in the context of protests and whether the coverage flags violence around the protests.
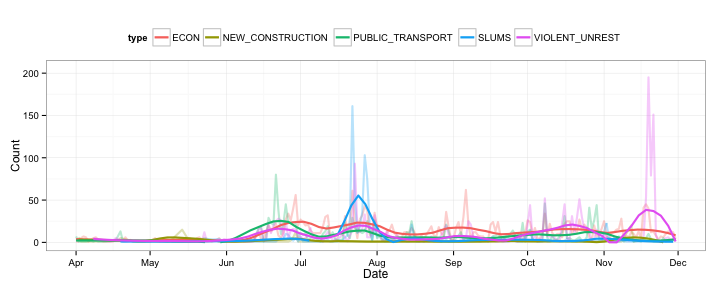
The lighter, more variable lines show the raw counts of protests with that theme each day. The darker, smoother lines are a LOESS curve to smooth out some of the fluctuations (see the R Markdown document for the span).
It's important to remember that “themes” are not necessarily the demands of of the protesters, but rather the themes of the coverage of the protests. Thus, a protest with a “security services” theme isn't necessarily a protest against police brutality and could mean just that the article mentioned a police presence at the protest.
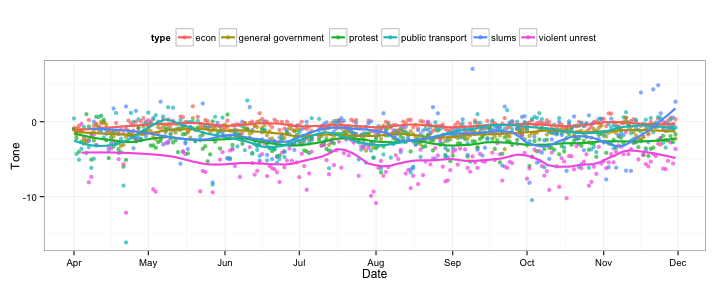
Tone of Coverage
GDELT also includes several measures of article tone, reporting scores of positive and negative word use, polarity, and how emotionally charged the text is (see the GKG codebook for details). Because GKG includes all source URLs, local coverage can easily be disaggregated using the local country's top level domain and analyzed separately from international coverage. Local English-language coverage is often sparse, though, and in a place like Egypt, is entirely government controlled. Here, I show only the aggregate tone score per day for each theme, with -100 being extremely negative and 100 being extremely positive, and most values falling between -10 and 10.

The hope with using the tone score is that merely knowing the levels or counts of an activity isn't enough to make an accurate assessment of the event's importance, while knowing the details of the event and how it's covered will give a better sense of the event and its implications. Unfortunately, this chart is the most difficult to understand. Does the negative dip in the average tone for “violent unrest” in late July indicate that public sentiment is turning away from the protesters? Or is the sentiment scoring reflecting specific negative words in the coverage like “beat,” “violent,” and “mayhem”? Or is the violence becoming worse and more widespread? This is the area that needs the most work before it can be useful.
Comparision to Latin American Protest Themes
Finally, we can easily compare the distribution of the themes around Brazilian protests with other protests in Latin America (as reported by the news media).
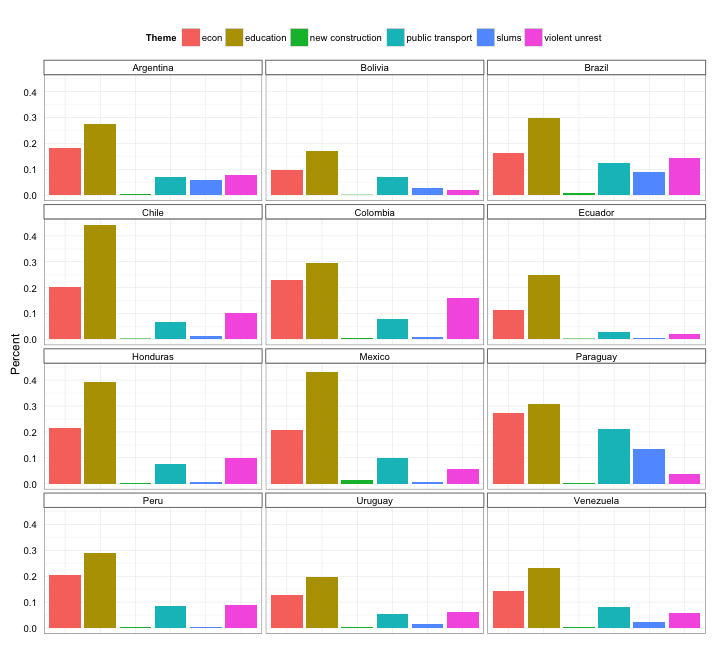
Again, GKG's themes do not correspond exactly with the demands of proteters. The “education” theme is likely picking up the involvement of students in the protests, given the strong tradition of student involvement in demonstrations. The public transportation component of Brazil's protests is clearly high, but not overwhelmingly different from other countries in the region. Paraguay, in particular, has a very high percentage of protests with a public transportation theme, through this could potentially be an artifact of low levels of reporting on Paraguay. The education and and slums themes show lots of variation, which perhaps reflect the different involvement of students in protests and potentially whether protests occur in slums or favelas more often in some countries than others.
It's clear from the selected themes over time line graph that the importance of public transportation, slums, and violent unrest for Brazilian protests has changed over time. Comparing different phases of the protests to the rest of the region could reveal more variation, but at the cost of small numbers and thus greater noise.
Conclusion
- GKG can be very useful without going into its full and complicated network structure. Making solid inferences from network data is difficult, especially when it needs to be normalized to account for certain nodes having a huge proportion of connections (e.g., Barack Obama). Hopefully a community approach to addressing the long tail of network connections in GKG will start to emerge, as it is for GDELT's nonstationary event stream. Visualizing GKG's network structure in a way that will lead to real insights is very difficult. But GKG's inclusion of theme information makes it a valuable addition to event data approaches to studying protest activity.
- While themes are very easily to interpret, as long as they are interpreted in the context of media coverage, tone is much more difficult. Without much more work, it seems difficult to distinguish between different reasons for tone to change. Tone for a theme can be affected by changing local coverage, international coverage, and changes in coverage of other themes discussed in the same article. An increase in the tone score (more positive coverage) for something that should be negative (e.g., violent unrest), could reflect improvements in the problem, a heartwarming human interest story, or potentially approval of the acts. While tone should be a valuable new source of data, especially for forecasting, in terms of interpretability it may be more appropriate for tracking media perceptions of people and organizations, rather than themes.
- You can work with GKG in R, but it's not pretty. All of this analysis was done entirely in R, but with very ugly and slow looping through the files and filtering using grep. See the R markdown version of this post with all R code. I'm very interested in how other people are working with GKG since I don't think my setup is very good at all.
Feel free to contact me on Twitter (@ahalterman) or at my Gmail address (ahalterman0).